
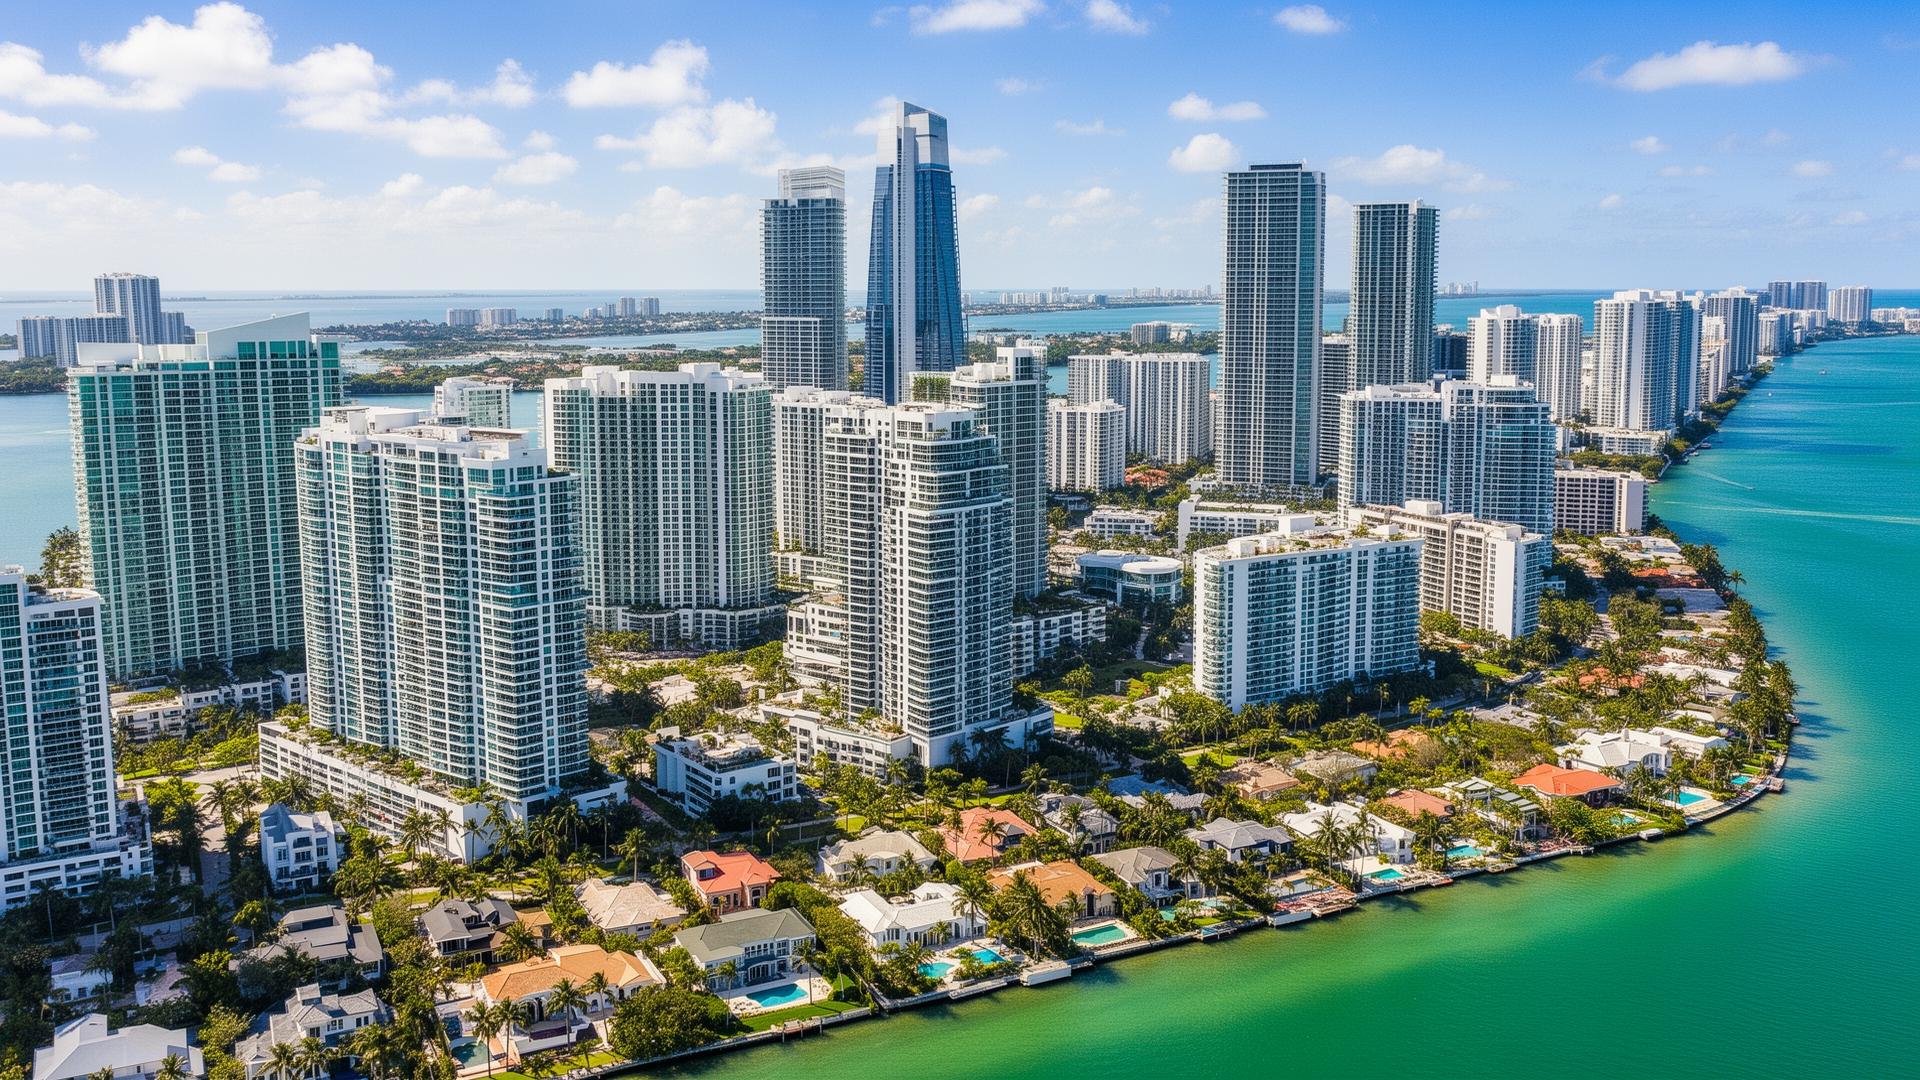
South Florida commercial real estate forecast for 2026
The 2026 South Florida commercial market is better described as stable and segmented than as uniformly strong. Office fundamentals have firmed in Miami, with overall vacancy at 15.0% and average asking rent at $66.16 per square foot in Q1 2026, up 5.3% year over year, while industrial has shifted from record-tight to balanced, with Miami-Dade vacancy at 6.8% [1][2]. The through-line for investors is that pricing is now set by fundamentals and financing cost, not momentum, because the Federal Reserve held its target range at 3.50% to 3.75% in June 2026 [3]. This post walks through office, industrial, and retail with sourced figures and the rate backdrop that ties them together.
Last updated: July 2026
Office: firmer, but bifurcated
Miami office is a two-tier market. Overall metro vacancy was 15.0% in Q1 2026 with average asking rent of $66.16 per square foot, a 5.3% year-over-year increase, per CBRE [1]. Within that average, Brickell Class A commanded roughly $101.76 per square foot, well above the metro figure, reflecting sustained demand for trophy space in the core [1].
The practical read for investors: the average and the top of the market are diverging. Newer, well-located Class A space is holding rent and occupancy, while older commodity space carries most of the vacancy. Underwrite the specific building and submarket, not the metro headline. Investors comparing core submarkets often start with a buyer consultation to map rent and vacancy at the building level.
Industrial: from scarcity to balance
Industrial was the tightest South Florida sector during the pandemic cycle, and it has normalized rather than weakened. Miami-Dade industrial vacancy was 6.8% in Q1 2026, with availability at 9.6% and average asking rent of $16.84 per square foot, up 2.4% year over year [2]. Net absorption of 540,000 square feet in Q1 2026 was positive but trailed the prior-year quarter by 24%, and the construction pipeline fell to 4.1 million square feet from 6.6 million, which is why supply is self-correcting rather than overbuilding [2].
For owners, the takeaway is that the sector still absorbs space and holds rent, but the era of automatic double-digit rent growth is over. Last-mile distribution near population density remains the most defensive segment.
Retail and net lease: priced off credit and rates
Single-tenant net-lease retail, the format most individual investors buy, averaged a 6.55% cap rate nationally in Q1 2026, with all single-tenant net-lease product at 6.80% [4]. Well-located, strong-credit retail on dense corridors continues to trade, but pricing is disciplined and tied to tenant credit and remaining lease term rather than to headline neighborhood prestige. I have removed the prior version's unsourced claim of sub-4% trophy-retail cap rates because I could not source it to a named report.
The interest-rate backdrop
Every 2026 commercial thesis runs through the cost of capital. The Federal Reserve held the federal funds target range at 3.50% to 3.75% in June 2026, its fourth consecutive hold, and the June projections showed the committee split on whether the next move is a hold or a hike [3]. For borrowers, that means financing costs are stable but not falling, so equity-heavy structures and conservative leverage remain the norm. Deals that only worked at 2021 debt costs do not pencil today.
Medical office and specialized assets
One structural trend worth watching in 2026 is the durability of medical office buildings (MOBs) relative to commodity office. Medical tenants sign long leases, invest heavily in their build-outs, and serve demand that does not track the economic cycle the way discretionary office use does. That combination gives well-located medical office a more defensive income profile than general Class B office, which is why some investors have rotated into it as they trim exposure to older commodity space. As with any asset, the return still depends on tenant credit, lease term, and the specific building, so treat the sector characteristic as a starting screen rather than a guarantee.
The same logic applies to other specialized formats: self-storage, single-tenant net-lease pads, and last-mile industrial each carry different demand drivers than traditional office and retail. In a stable-but-not-falling rate environment, buyers have generally favored assets with contractual, credit-backed income over those that depend on near-term rent growth to hit their return.
Where the capital is coming from
South Florida commercial deals in 2026 continue to draw a mix of domestic private capital, family offices, and international buyers. Foreign capital in particular has treated Florida income property as a place to hold value, which supports transaction volume even in a higher-rate environment where leverage adds less to returns. The practical effect for a seller is a deeper buyer pool for well-located, income-producing assets; the practical effect for a buyer is competition for the same limited supply of strong-credit, well-located product. Neither dynamic replaces underwriting: the price still has to work against today's debt cost and the specific asset's income.
Florida's tax position
One durable structural factor: Florida's constitution prohibits a state personal income tax (Article VII, Section 5), so investment income is not reduced by a state income tax [5]. This supports continued in-migration of capital, though it is one input into underwriting, not a substitute for it.
What this means for owners and buyers
- Owners: Firm office rents in core submarkets and stable industrial rents create a reasonable window to test value, but buyers are underwriting to today's debt costs. Get a current listing valuation before assuming a peak-cycle price.
- Buyers: Underwrite the specific asset and submarket. The metro averages hide wide dispersion between Class A and commodity space.
The broader point for 2026 is that the South Florida commercial market rewards specificity. There is no single number that describes it: office is firming in the core while commodity space lags, industrial is balanced rather than tight, and net-lease retail is priced off credit and rates. An investor who underwrites the specific building, tenant, and submarket, against today's cost of debt, will get a far more reliable read than one who buys the headline that Miami is up or down. Pull the sourced figures, adjust to the asset in front of you, and stress-test the financing before you commit.
Frequently asked questions
Is the Miami office market recovering in 2026?
Miami office vacancy was 15.0% in Q1 2026 with asking rent up 5.3% year over year to $66.16 per square foot, indicating firming fundamentals, though the recovery is concentrated in Class A and core submarkets like Brickell [1].
How tight is South Florida industrial in 2026?
Miami-Dade industrial vacancy was 6.8% in Q1 2026, with rents up 2.4% year over year and the construction pipeline shrinking, which points to a balanced rather than oversupplied market [2].
What cap rates apply to net-lease retail right now?
National single-tenant net-lease retail averaged 6.55% in Q1 2026, with all single-tenant net-lease product at 6.80% [4]. Specific Miami assets vary with tenant credit and lease term.
How do interest rates affect the 2026 outlook?
The Federal Reserve held rates at 3.50% to 3.75% in June 2026 [3]. Stable but elevated financing costs keep cap rates from compressing and favor conservative leverage.
Gabriel
Sources
- CBRE, Miami Office Figures, Q1 2026
- CBRE, Miami Industrial Figures, Q1 2026
- Federal Reserve, FOMC statement, June 17, 2026
- The Boulder Group, Net Lease Research Report, Q1 2026 (via Chain Store Age)
- Florida Constitution, Article VII, Section 5, via State of Florida Tax Guide
Gabriel A. Moyers, PA. eXp Realty. Florida License #3407280. Equal Housing Opportunity. This article is general information as of July 2026 and is not legal, tax, or financial advice. Verify current figures against authoritative sources before acting.
Thinking of selling your luxury property in Miami? Find out what your home is worth.
Get Your Home ValuationLooking for your dream home in Miami? Take our personalized home search quiz.
Start Your Home Search Quiz