
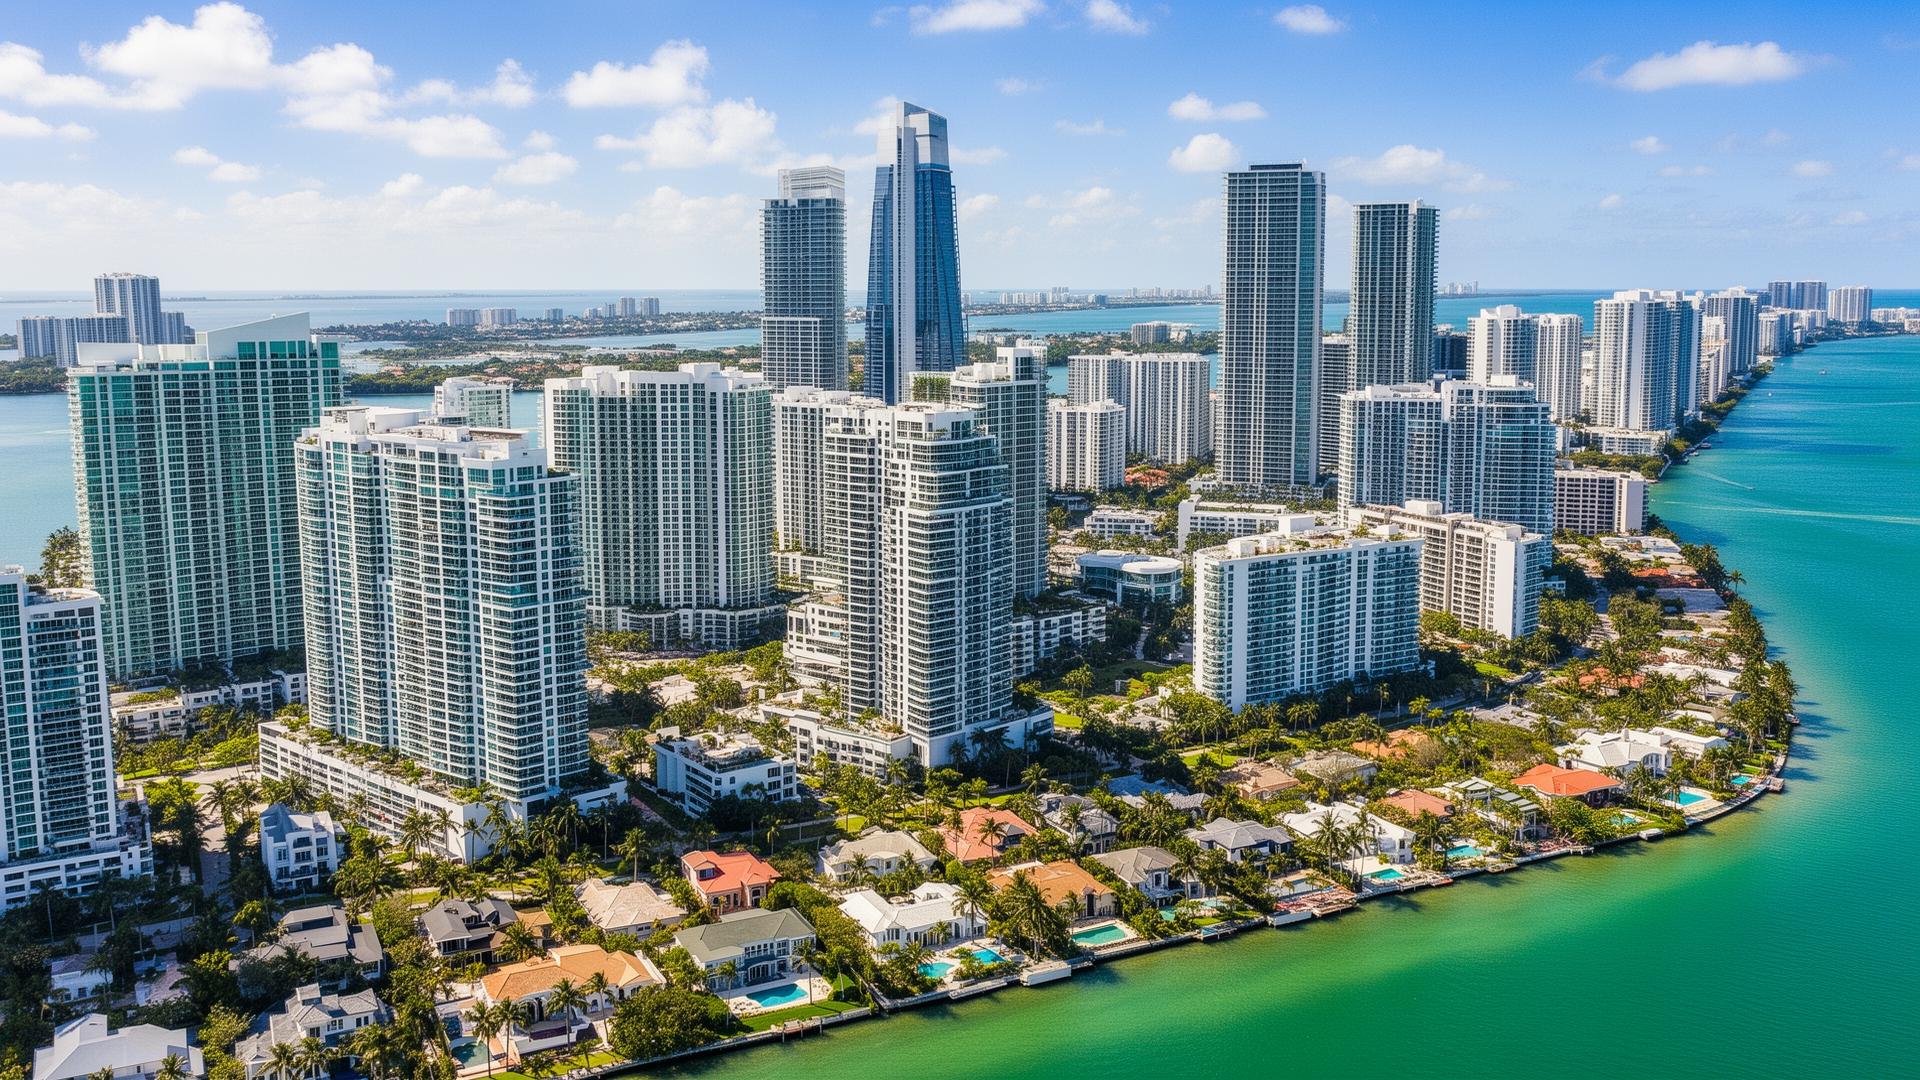
South Florida inventory levels vs the national average in 2026
Is South Florida oversupplied, or is it still tight? As of early 2026 the honest answer is that it depends entirely on property type, and the local numbers run the opposite direction from the headline you might expect. Miami-Dade single-family inventory sat at a 6.4-month supply in January 2026, which is a broadly balanced market, while the condominium side carried a 13.7-month supply, which favors buyers [1]. Nationally, the existing-home market held a 4.5-month supply in May 2026 [2]. So Miami-Dade single-family homes are tighter than condos but looser than the national single-family picture, and the condo market is meaningfully softer than the U.S. average. There is no single "South Florida number," and anyone quoting one is skipping the part that matters.
Last updated: July 2026
Miami-Dade versus the national market
The national existing-home market carried a 4.5-month supply of unsold inventory in May 2026, unchanged from the prior month and down slightly from 4.6 months a year earlier, per the National Association of Realtors [2]. Roughly six months of supply is the conventional line between a buyer's and seller's market, so the U.S. as a whole is still on the tighter side of balanced.
Miami-Dade does not move as one block. In January 2026, single-family listings rose about 9% year over year to 5,433 homes, which worked out to a 6.4-month supply, close to balanced [1]. Condominiums told a different story: about 12,509 units on the market, a 13.7-month supply, which is firmly a buyer's market [1]. That gap between houses and condos is the single most important fact in the local data, and it is why a blanket "seller's market" or "oversupplied" label is wrong in both directions.
Why the two property types diverged
Several structural factors sit behind the split:
- Insurance and assessments on older condos. Post-2021 structural-reserve requirements and special assessments have pushed carrying costs up on many aging condo buildings, cooling demand and lengthening days on market.
- New condo deliveries. Several towers reached completion in 2024 and 2025, adding resale and sponsor units to an already-supplied segment.
- Land constraint on single-family. Miami-Dade is bounded by the Atlantic to the east and the Everglades protection area to the west, which limits new single-family lot creation and keeps that segment tighter than the condo segment.
What the price data shows
Inventory only matters alongside price. In January 2026, the Miami-Dade single-family median sale price was $699,990, up 3.7% year over year from $675,000 [1]. The condo median was $420,000, up modestly from $415,000 a year earlier [1]. Across all property types and using a rolling three-month window ending May 2026, one broker dataset put the broader Miami median near $652,000 [3].
The read-through is that single-family pricing is still grinding higher on limited supply, while condos are close to flat on heavy supply. If you are underwriting a purchase, the property type changes your negotiating position more than the zip code does. A house near balanced supply gives a seller reasonable leverage; a condo sitting in a 13-plus-month market gives a buyer room to negotiate on price, credits, and assessment coverage.
Where the leverage sits by segment
For a buyer, the condo segment is where concessions are realistic right now, particularly in older buildings carrying reserve or assessment questions. For a single-family buyer, the math is tighter, and overpricing is still punished less than it is in a true buyer's market. For a seller, the mistake is pricing a house to national headlines about softening, or pricing a condo as if the single-family scarcity applies to it. If you want to see how your specific property maps to current absorption, a listing valuation grounded in recent closings is the place to start.
How to read months of supply
Months of supply is a simple ratio: active listings divided by the pace of monthly sales. It answers the question of how long it would take to sell everything currently listed if no new inventory arrived. The conventional interpretation is that roughly six months is balanced, below that tilts toward sellers, and above that tilts toward buyers. That framework is why the Miami-Dade split matters so much: at 6.4 months, single-family homes sit right at the balance line, while at 13.7 months, condos are more than double it [1].
Two cautions apply when using this number. First, it is a snapshot that can move quickly if sales pace changes, so a single month's reading is a direction, not a destiny. Second, county-level supply averages away real differences between submarkets and price bands. A well-priced house in a tight inland pocket and an aging waterfront condo in an over-supplied building can both live inside the same county averages while facing completely different negotiating dynamics. The county number is a starting point, not the answer for your specific property.
What could shift the balance
The current split is not permanent. On the condo side, several things could tighten supply over time: buildings resolving their reserve funding and clearing special assessments, insurance markets stabilizing, and buyers returning once carrying-cost uncertainty fades. On the single-family side, higher mortgage rates continuing to keep existing owners in place would keep new listings scarce and supply tight, while a meaningful rate decline could bring more sellers off the sidelines and loosen it.
For now, the reasonable base case is that the two segments stay on different tracks: single-family near balanced, condos favoring buyers. That argues against treating any single regional headline as a buy or sell signal. The number that should drive a decision is the supply and absorption in your exact segment and area, not the county composite and certainly not the national figure.
What this means for buyers and sellers
For buyers, the data does not support waiting on a broad "crash." Single-family supply is near balanced and prices are still rising modestly [1]. The opportunity is segment-specific: condos, older buildings, and units where the seller needs to move. For sellers, the days of listing without a pricing strategy are over on both property types, and especially on condos where a buyer has a dozen-plus months of alternatives.
The practical move is to underwrite the specific building or street rather than the county. Two condos in the same tower can carry very different assessment exposure, and two houses on the same block can sit in different flood zones with different insurance costs. If you want to work through the micro-data for a target area or your own home, a buyer consultation is the right next step.
Frequently asked questions
Is South Florida a buyer's or seller's market in 2026?
It depends on property type. In January 2026, Miami-Dade single-family homes were near balanced at a 6.4-month supply, while condos were a buyer's market at a 13.7-month supply [1]. There is no single answer for the whole region.
How does Miami-Dade inventory compare to the national average?
The national existing-home market held a 4.5-month supply in May 2026 [2]. Miami-Dade single-family supply was higher at 6.4 months, and the condo segment was much higher at 13.7 months [1]. So Miami-Dade is not tighter than the country on either measured segment as of these reports.
Are Miami home prices still rising?
Single-family prices are. The Miami-Dade single-family median rose 3.7% year over year to $699,990 in January 2026, while the condo median was roughly flat near $420,000 [1].
Where is the negotiating room right now?
Mostly in condos, especially older buildings with reserve or assessment questions, given the 13.7-month supply [1]. Single-family homes near balanced supply leave sellers more leverage [1].
Gabriel
Sources
- MIAMI REALTORS / World Property Journal, Miami-Dade January 2026 Housing Report
- National Association of Realtors, Existing-Home Sales Report, May 2026
- Redfin, Miami, FL Housing Market
Gabriel A. Moyers, PA. eXp Realty. Florida License #3407280. Equal Housing Opportunity. This article is general information as of July 2026 and is not legal, tax, or financial advice. Verify current figures against authoritative sources before acting.
Thinking of selling your luxury property in Miami? Find out what your home is worth.
Get Your Home ValuationLooking for your dream home in Miami? Take our personalized home search quiz.
Start Your Home Search Quiz