
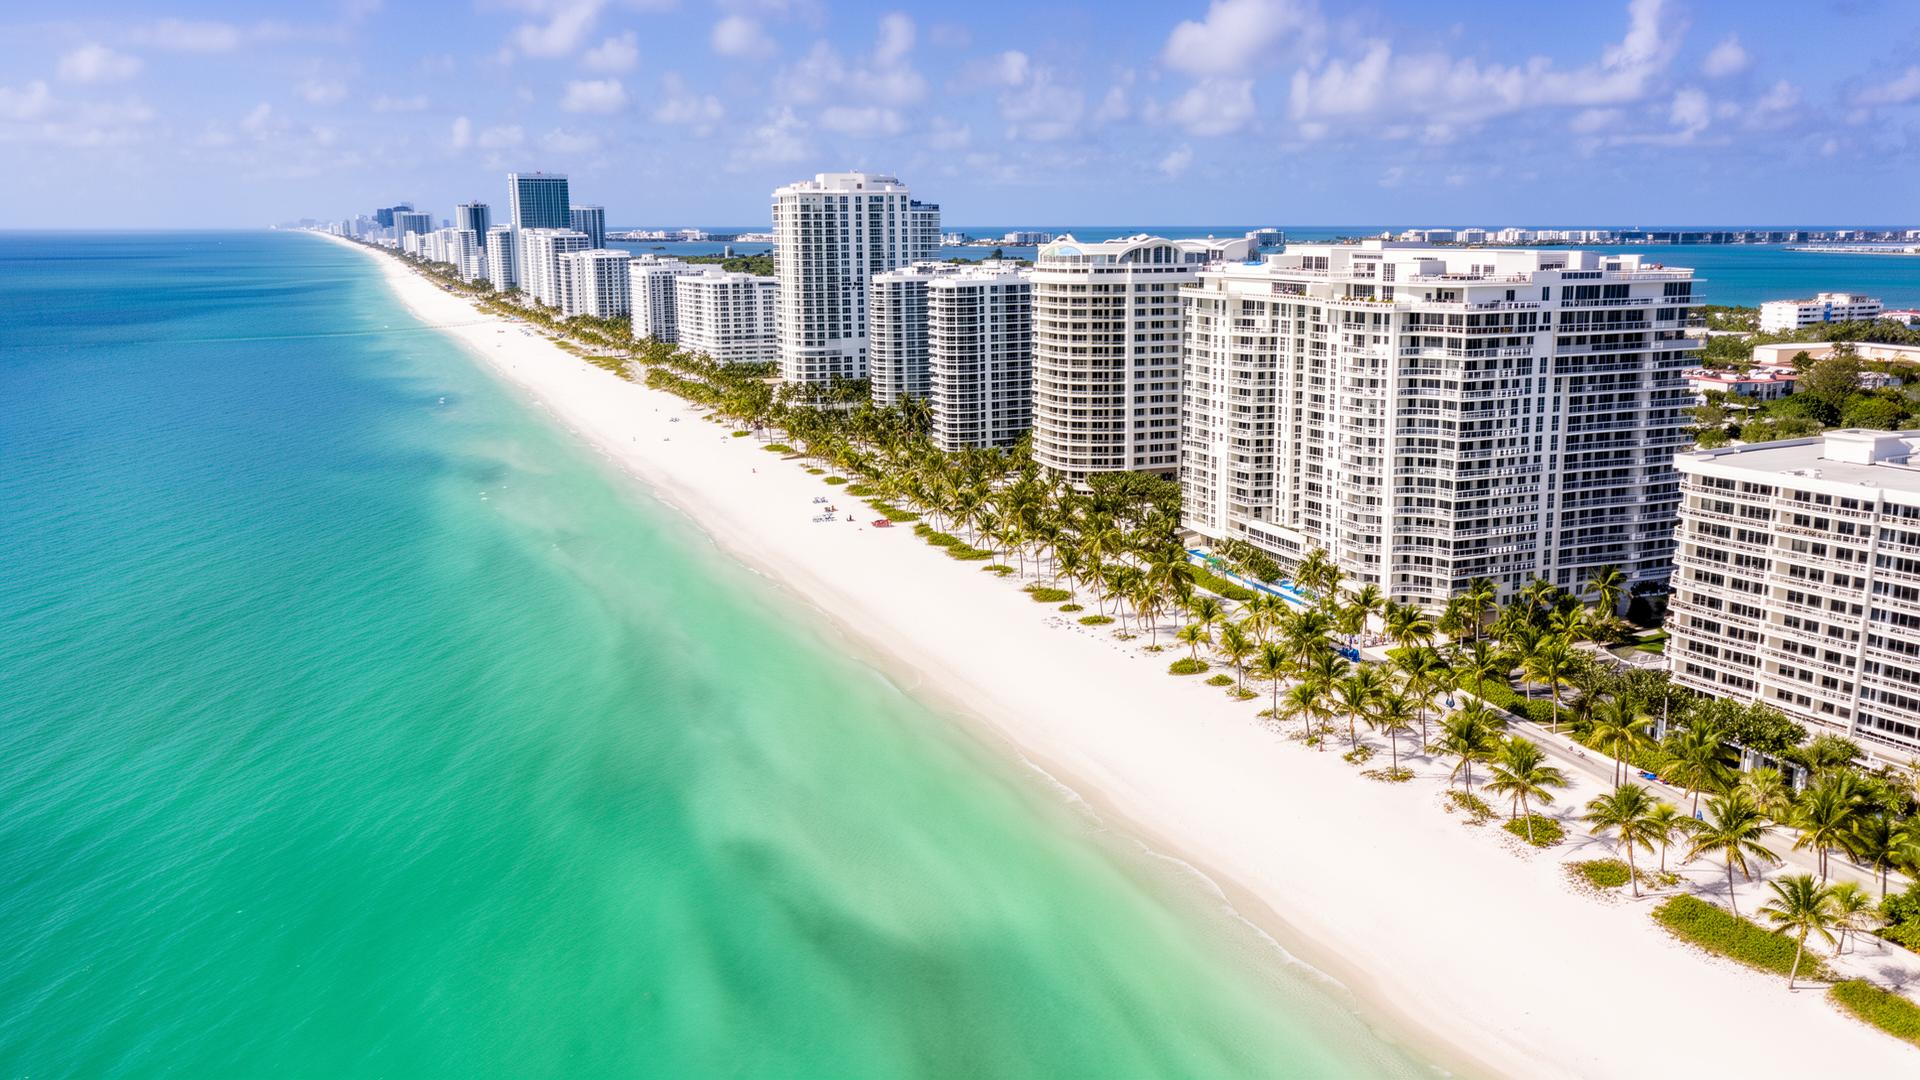
Climate migration and Miami property demand
Climate migration cuts both ways in Miami, and honest underwriting has to hold both facts at once. On the demand side, Miami-Dade keeps drawing people for tax, business, and lifestyle reasons, and the county still grows on paper. On the risk side, Miami is one of the most sea-level-exposed metros in the country, and that risk is already showing up in where money flows inside the county. So the useful question is not whether climate migration lifts Miami demand in the abstract. It is whether a specific parcel, at a specific elevation and flood zone, pencils out over the 30-year hold you are actually signing up for.
This post separates the two forces, cites the numbers you can source, and gives you an underwriting checklist for pricing climate risk into a Miami purchase. It is written for buyers and investors who want the downside case, not a sales pitch.
Last updated: July 2026
Two forces are moving Miami prices at the same time
The first force is in-migration. People and capital keep arriving in South Florida, and international arrivals in particular have kept the county's headline population growing. The second force is repricing by elevation. Within Miami-Dade, higher-elevation land has appreciated faster than low-lying, flood-exposed land, which is a market already pricing in sea level rise even while the region grows overall.
Those two forces are not contradictory. The county can add residents and still see waterfront and low-elevation parcels carry a widening risk discount in the form of higher insurance, stricter lending, and slower appreciation. If you only track the growth headline, you miss the repricing happening underneath it.
What the migration data actually shows
The migration story is more specific than "everyone is moving to Miami." According to U.S. Census Bureau estimates for July 2023 to July 2024, Miami-Dade County reached roughly 2.84 million residents, but the components of that change matter more than the total. Net international migration was about 123,835, the highest of any county in the nation, while net domestic migration was negative at about -67,418 [1]. In plain terms, more people moved from Miami-Dade to other parts of the United States than moved in from them. International arrivals and births are what kept the county growing.
For underwriting, that distinction is the whole point. Demand driven by international capital and in-migration tends to concentrate in specific price tiers and product types, and it can shift with immigration policy, foreign-exchange rates, and global conditions. It is not the same as broad, sticky domestic demand. Do not underwrite a purchase on "climate refugees are flooding in" as a durable thesis. The sourced data shows a county leaning on international migration to offset domestic outflow, which is a more fragile mix than the growth headline suggests.
Miami is a climate-risk market, so price it in
Miami is a destination and a risk market at the same time, and the second half of that sentence does not get enough weight in listing copy. The relevant variables are elevation, flood zone, and the trajectory of insurance carry. Here is what you can source on each.
Sea level rise projections you can underwrite against
The Southeast Florida Regional Climate Change Compact publishes a unified sea level rise projection that local governments use for planning and design. Relative to a 2000 baseline, it projects roughly 10 to 17 inches of rise by 2040 and 21 to 54 inches by 2070 [2]. The Compact reviewed these figures again in late 2024 and affirmed their continued use. This is a regional planning consensus, not a worst-case outlier, and it is the projection your local building and stormwater codes are increasingly designed around.
A foot or more of additional water by the time a 2026 buyer is mid-hold is not abstract for a low-elevation lot. It shows up as more frequent nuisance and king-tide flooding, higher base flood elevations on future maps, and rising costs to elevate, pump, and insure. If you are buying at two or three feet of elevation, you are underwriting against that curve whether you acknowledge it or not.
Elevation is now a pricing variable
The repricing is already visible in the research. In a peer-reviewed study of Miami-Dade single-family homes, researchers found that higher-elevation properties appreciated faster than lower-elevation ones, consistent with the market beginning to price in sea level risk [3]. That elevation-and-price relationship is a market signal you can use directly: elevation is now a valuation input alongside square footage, lot, and condition.
To be clear about scope, this is a statement about land, elevation, flood exposure, and price. It is not a statement about who lives at any elevation, and it should not be used to characterize any neighborhood by its residents. The underwriting takeaway is narrow and factual: two otherwise similar Miami homes can carry different long-run risk and different appreciation trajectories because one sits higher and drier than the other. Barrier-island and low-lying coastal areas such as much of Miami Beach face different flood and elevation math than higher-ground inland areas like Coral Gables, and that math belongs in your price.
The insurance carry line on a 30-year hold
Insurance is where climate risk hits your monthly math, and it moves in both directions. Florida premiums rose sharply through the early 2020s, then reform slowed the increases. Statewide rate increases that ran above 21% in 2023 had moderated by 2025, and Citizens Property Insurance, the state-backed insurer of last resort, filed for an average personal-lines rate decrease of about 2.6% effective June 2026, with roughly half of personal-lines customers seeing a larger cut [4]. That is genuine relief, and it deserves to be reported honestly rather than buried under a crisis narrative.
Flood coverage is a separate line, and it is now priced to the property. Since the National Flood Insurance Program fully implemented Risk Rating 2.0 in April 2023, flood premiums reflect a specific structure's characteristics, including distance from water, flood frequency, foundation type, and the height of the lowest floor relative to the base flood elevation, rather than a broad zone table. Most annual increases are capped at 18%, which means a property currently priced below its full risk can keep stepping up year after year until it reaches that level [5]. When you underwrite carry, model the flood premium on its trajectory toward full risk, not just this year's quote.
Underwriting a 30-year hold against a 30-year risk curve
Here is the discipline. If you are signing a 30-year mortgage, you are taking a position on a 30-year risk curve, so underwrite them together.
- Pull the elevation. Get the lowest-floor elevation and lot elevation, not just the flood-zone letter. A few feet changes both flood premium and long-run resale.
- Read the flood map and the Risk Rating 2.0 quote. Ask for the current premium and model it stepping up toward full risk under the 18% annual cap.
- Underwrite carry, not just price. Total the mortgage, property insurance, flood insurance on its trajectory, taxes, and any elevation or mitigation capital the property will need.
- Stress the exit. If elevation-based repricing continues, a low-lying parcel may appreciate more slowly and take longer to sell. Model a conservative appreciation rate for low-elevation product.
- Separate the demand thesis from the risk thesis. In-migration may support the top-line market while your specific lot still carries an elevation and insurance discount.
None of this means avoid Miami. It means buy the right elevation and flood profile for your hold period and your risk tolerance, and pay a price that reflects the carry. If you want a data-driven read on a specific address, that is exactly what a buyer consultation is for.
Frequently asked questions
Does climate migration increase Miami property demand?
It contributes, but the sourced picture is mixed. Census estimates for 2023 to 2024 show Miami-Dade growing mainly on international migration and births while losing residents to domestic out-migration [1]. Treat in-migration as one demand input, not a guaranteed one-way tailwind.
Is buying in Miami a bad idea because of sea level rise?
Not inherently. The risk is real and unevenly distributed. Regional projections point to roughly 10 to 17 inches of rise by 2040 and 21 to 54 inches by 2070 above a 2000 baseline [2], which matters far more for a low-elevation lot than a high-and-dry one. The decision comes down to elevation, flood profile, insurance carry, and price.
What is climate gentrification in Miami?
It is a research term for a pricing pattern: higher-elevation land in Miami-Dade has appreciated faster than lower-lying land as the market prices in flood risk [3]. Used correctly it describes land and price, not people. For underwriting, it means elevation is a valuation variable you should price in.
How much does flood insurance affect the numbers?
Potentially a lot over a long hold. Under FEMA's Risk Rating 2.0, flood premiums are set to each property's specific risk and can rise up to 18% per year toward full-risk pricing [5]. Always model the flood premium on its trajectory, not just the first-year quote.
Which Miami areas carry more climate risk?
Low-elevation and barrier-island locations generally face more flood and sea-level exposure than higher-ground inland areas. That is a statement about elevation and flood maps, not about residents. Compare the specific elevation and flood zone of any two properties before you compare their prices.
Gabriel
Sources
- U.S. Census Bureau Vintage 2024 population estimates, Miami-Dade components of change (as reported)
- Southeast Florida Regional Climate Change Compact, Unified Sea Level Rise Projection for Southeast Florida
- Keenan, Hill and Gumber, "Climate Gentrification: From Theory to Empiricism in Miami-Dade County, Florida," Environmental Research Letters (2018)
- Insurance Journal, "After Years of Pushing Rate Hikes, Florida's Citizens Now Wants HO Rate Decrease" (2025)
- FEMA, National Flood Insurance Program Risk Rating 2.0
Gabriel A. Moyers, PA. eXp Realty. Florida License #3407280. Equal Housing Opportunity. This article is general information as of July 2026 and is not legal, tax, or financial advice. Verify current figures against authoritative sources before acting.
Thinking of selling your luxury property in Miami? Find out what your home is worth.
Get Your Home ValuationLooking for your dream home in Miami? Take our personalized home search quiz.
Start Your Home Search Quiz